mineXpert2 User Manual
7 Recording data exploration discoveries
When doing mass analysis work it is often desirable to store the painstakingly manually picked m/z or Mr values for later use. mineXpert2 provides a flexible process allowing one to record the data exploration discoveries to a file, the clipboard, the console or any combination thereof.
In order to record the innumerous analysis steps that make a data exploration session, the → menu will open a dialog window shown in Figure 7.1, “Setting-up of the recording of the data exploration discoveries”.
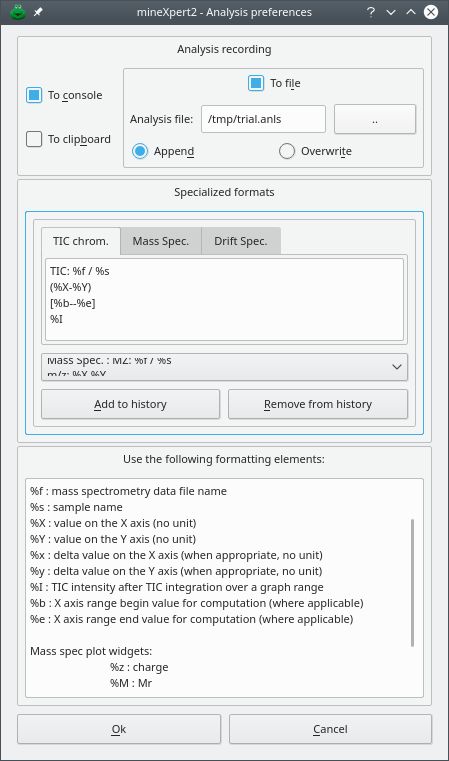
It is possible to configure the recording system to record to either the console, the clipboard, a file (in append mode or in overwrite mode) or any combination thereof. The format of the string is defined using special characters (see text) and might be defined specifically for the three main graphs: TIC/XIC chromatogram, mass spectrum and drift spectrum.
Figure 7.1: Setting-up of the recording of the data exploration discoveries #
In that window, the user can select the destination of the data analysis recording system: console, clipboard, file or any combination of the three. When selecting file recording, the user might specify if the recording would overwrite any preexisting file or, instead, append to that file. Depending on the kind of plot where data exploration occurs, the format of the data to be recorded needs to change. Indeed, it would make no sense to record the charge z when exploring data in the Drift spectra window. This is why the text format of the data export needs to be defined for each one of the three kinds of plots: TIC/XIC chromatogram, mass spectrum or drift spectrum (Specialized formats group box).
Before delving into the configuration intricacies, let us tell immediately how to trigger the recording of the exploration discoveries: using the SPACE bar in the composite plot widget containing the graph being analyzed.
The format used to define the text string to be stored on console and/or in file can contain particular tokens as described below:
%f : mass spectrometry data file name.
%s : sample name.
%X : value on the x-axis of the graph (no unit). For a drift spectrum, that would be drift times in milliseconds, for a mass spectrum, that would be m/z values, for a TIC/XIC chromatogram, that would be retention times in minutes.
%Y : value on the y-axis of the graph (no unit). In all the graph plots, that would be intensities in any unit provided by the mass spectrometer (typically, counts).
%x : delta value on the x-axis (when appropriate, no unit).
%y : delta value on the y-axis (when appropriate, no unit).
%I : TIC intensity after TIC integration over a graph range
%b : x-axis range begin point for the computation (where applicable, for example for the TIC integration to a single value).
%e : x-axis range end point for the computation (where applicable).
For mass spec plot widgets:
%z : charge
%M : Mr as computed during deconvolution (see Chapter 4, Mass Spectral Deconvolutions).
Note
It is important to keep in mind that the %z and %M format strings can only work if the user is actually analyzing a mass spectrum and if the user has effectively performed a deconvolution operation that has allowed computing these two values. If the values are not available, the program shows nan (“not a number”) in the textual output upon hitting the SPACE bar (see below). Likewise, the %I format string will only hold meaningful data if an integration to a single TIC intensity value has been determined (see Figure 3.11, “Integrating mass data from a mass spectrum to a single TIC intensity value”) for that specific data analysis record.
The recording of data analysis steps works in any trace plot widget (not yet in the color map plot widgets) even if there are more than one trace in a given plot widget. In the case the plot widget has more than one trace and none or more than one is selected, the program will ask that a single trace be selected. If data are to be scrutinized for more traces, simply select each trace in turn and trigger the analysis stanza to be output using the SPACE bar each time.
Once configured, the format strings might be stored in a drop down box for later use. To that end, click onto the Add to history button while having the format text displayed in the text editor and it will be appended to the drop-down list. The list gets stored when the dialog window is closed and will be filled-up again when the program is restarted.
As an example, if the user defined the following format string for a mass spectrum graph:
Mass spec. :
mz = (%X, %Y) z = %z
filename = %f
date = 20161021
session = 20161021
mslevel = 1 msion = esi msanal = tof
chrom = DEAE fraction = 25
seq = pos = oxlevel = 0 pos =
intensity =
comment =
Then, a resulting data exploration stanza that would be recorded will look like this:
Mass Spec. :
mz = (1051.8, 50863) z = 1
filename = 20161017-rusconi-frac-25-deae-20160712.mzml
date = 20161021
session = 20161021
mslevel = 1 msion = esi msanal = tof
chrom = DEAE fraction = 25
seq = pos = oxlevel = 0 pos =
intensity =
comment =
Interestingly, the user can define any kind of format, leaving fields available for later filling-in. This feature is of immense value when the analysis file is used later to fill-in a database for easy storage and interrogation of the exploration discoveries. In this case, it would be useful to have the file opened in an editor and at each new stanza, edit the comment field if something needs to be commented, like the shape/intensity of a mass peak, for example.
Note that the program closes the file each time a new stanza has been written. This makes it possible to edit that file safely in between each stanza record. Remember to force the editor to reload the file from disk after each exploration discovery recording.
When the recording involves sending the analysis data to the console, the data are sent to it as text that is colored the same as the spectrum that was under scrutiny.
When the mouse cursor has been placed at the proper location on the graph
(with or without  -click-dragging, depending on the situation), the user
hits the SPACE bar and the data analysis stanza is recorded
to the selected destination(s): console, clipboard, file.
-click-dragging, depending on the situation), the user
hits the SPACE bar and the data analysis stanza is recorded
to the selected destination(s): console, clipboard, file.