mineXpert2 User Manual
4 Mass Spectral Deconvolutions
When analysing a mass spectrum, two major deconvolutions are performed to get back to the Mr mass of the analyte while reading m/z values: the charge-based deconvolution and the monoisotopic cluster-based deconvolution. In the following sections, both deconvolutions are described.
Before delving in the deconvolutions, it is necessary to present two menu options that are found in the plot widgets contained in the Mass spectra window: the menu items under the Deconvolutions menu (Figure 4.1, “Mass spectrum plot widget-specific deconvolution menu”).
The two menu items are needed to configure the mouse-based deconvolution of mass spectra.
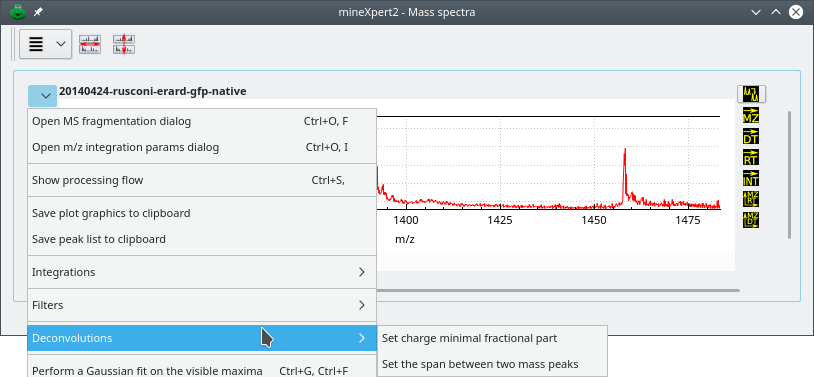
Figure 4.1: Mass spectrum plot widget-specific deconvolution menu #
These two menus allow one to set parameters for the deconvolution (see text for details).
4.1 Deconvolution based on charge state #
In this kind of deconvolution, at the present time, the software assumes that the ionization agent is the proton and that the ionization is positive.
The deconvolution is based on the determination of the distance between
two peaks —consecutive or not— of a given charge state
envelope. When the user  -click-drags the cursor from one peak to
another, the program tries to calculate if the distance between two peaks
matches one or more charge difference(s). If so, it computes the molecular
(Mr) mass of the analyte whose mass peak is located under the
cursor.
-click-drags the cursor from one peak to
another, the program tries to calculate if the distance between two peaks
matches one or more charge difference(s). If so, it computes the molecular
(Mr) mass of the analyte whose mass peak is located under the
cursor.
Note: The mouse drag position is significant
Note that the -click-dragging direction (left→right or
right→left) has an impact on the value of the charge
z that is obtained, since that charge value is
computed for the peak located under the cursor at
the moment of the deconvolution. Conversely, the mouse-dragging
direction has no effect on the Mr ([12C]-relative molecular mass) of
the analyte obtained as a result of the deconvolution process.
Figure 4.2, “Charge state-based mass deconvolution” shows that process for a protein of Mr≃30599 Da. In the top panel, the deconvolution has involved two consecutive peaks. This is the default setting. However, sometimes in low-amount sample mass spectra, two nicely configured consecutive mass peaks are not found, and it is necessary to search for peaks at more than one peak span. For that, use the to the required value (see Figure 4.1, “Mass spectrum plot widget-specific deconvolution menu”). In the lower panel, that span value was set to 2 and the deconvolution provided the same result (of course, since we went one more peak on the left side of the spectrum, that pointed peak corresponds to an ion bearing one more proton).
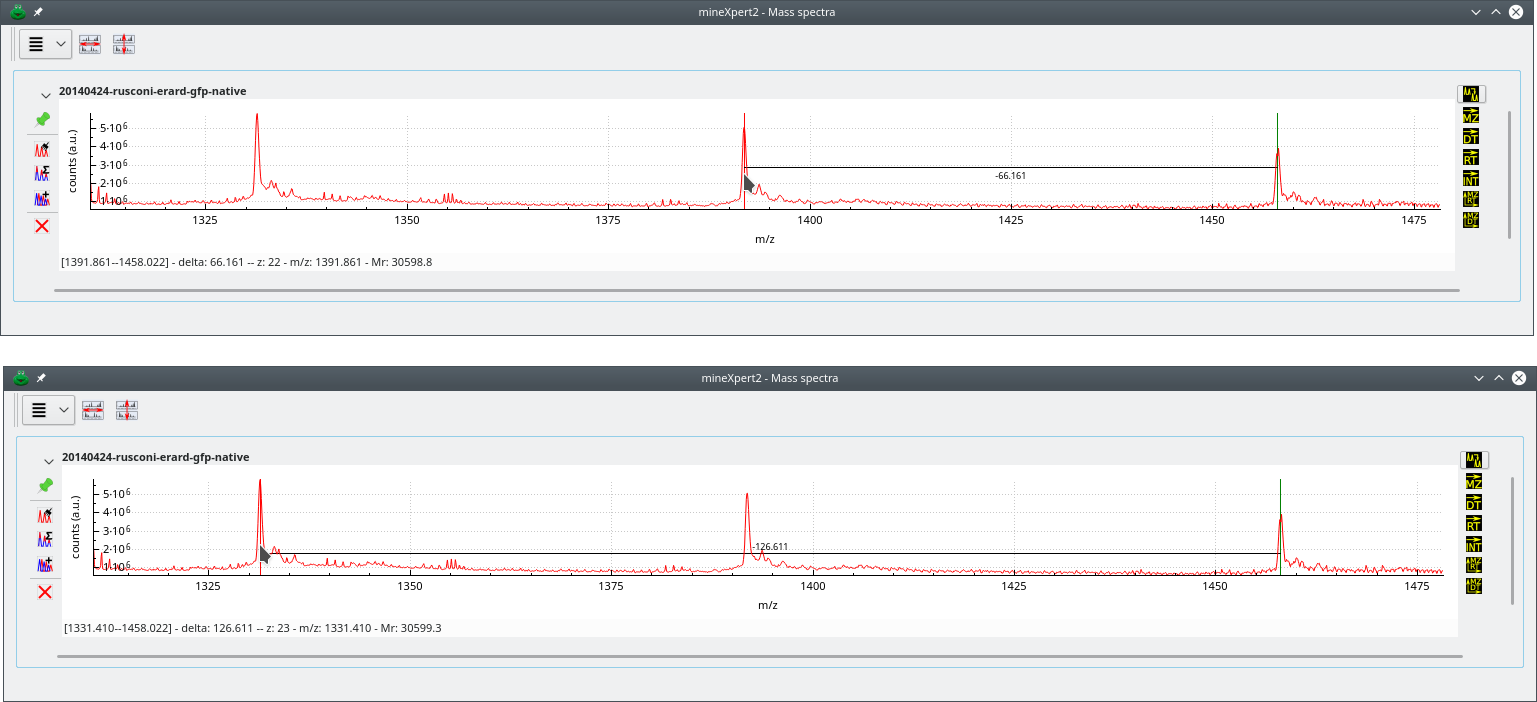
Deconvolution approach using two peaks belonging to the same charge state envelope. The top deconvolution involves two consecutive mass peaks (peak span value is 1). The bottom deconvolution involves two non-consecutive peaks (peak span value is 2). Note how going one more peak on the left side of the mass spectrum increments the protein charge by one unit. Also, the Mr does not change significantly. Of course, it should be identical in both cases, but that requires zooming-in, enlarging at maximum the spectrum region and carefully positioning the cursor both at the start and end peaks.
Figure 4.2: Charge state-based mass deconvolution #
The status bar of the window documents the current inter-peak distance
measurement operation that is performed by -click-drag of the cursor
from the start peak to the end peak. The start peak is marked with a green
marker and the end peak is marked with a red marker. Start and end positions
are documented in the form [left m/z—right m/z] (even if the mouse
drag was from right to left, the values are sorted). The m/z delta
value documents the distance between both start and end positions. When the
end position matches a theoretically expected distance corresponding to a
charge difference of 1 or more (depending on the value of the peak span),
then the charge z of the peak under the cursor is
provided and the molecular mass (Mr) is provided for
the analyte whose peak is under the cursor (m/z value documented).
Note
Note that the charge calculation almost never produces an integer value with no fractional part (say, charge z=15.0) because it is almost impossible to drag the mouse cursor the exact m/z range that would lead to such an integral charge value. Almost always, the charge that is calculated looks like 14.995 or 15.001, for example. Why is it impossible to drag the mouse cursor exactly the interval that would produce an integral charge value? Simply because the mouse moves at discrete positions on the screen and these positions might be more or less far apart, depending on the mouse capabilities and on the current zoom factor over the mass spectrum region of interest. It is advised to zoom-in as much as possible over the peaks at hand so as to minimize the difficulties above. It may happen, however, that even zoomed-in peaks are not sufficiently distant to allow a charge calculation. In this case, reduce the stringency over the fractional part that is allowed in the charge (see menu item Set charge minimal fractional part at Figure 4.1, “Mass spectrum plot widget-specific deconvolution menu”). By default, the stringency is set at 0.99, that is, any calculated value that has a fractional part either superior or equal to 0.99 or inferior or equal to 0.01 would lead to a successful round-up/round-down to the nearest integer value. Outside of the [0.01-0.99] interval, no charge calculation is performed and thus no deconvolution is performed. When the stringency is too high, reducing it will allow the deconvolution to be carried-over. My own experience is that setting that value to 0.995 is fine for most situations and provides very reliable results.
4.2 Deconvolution based on isotopic cluster peaks #
In this kind of deconvolution, the user -click-drags the cursor between
the first two peaks (when possible) of the isotopic cluster. The charge
state of the ion is the inverse of the distance between the two consecutive
peaks (that is, the m/z delta value). Figure 4.3, “Isotopic cluster-based mass deconvolution” shows that
deconvolution process at work.
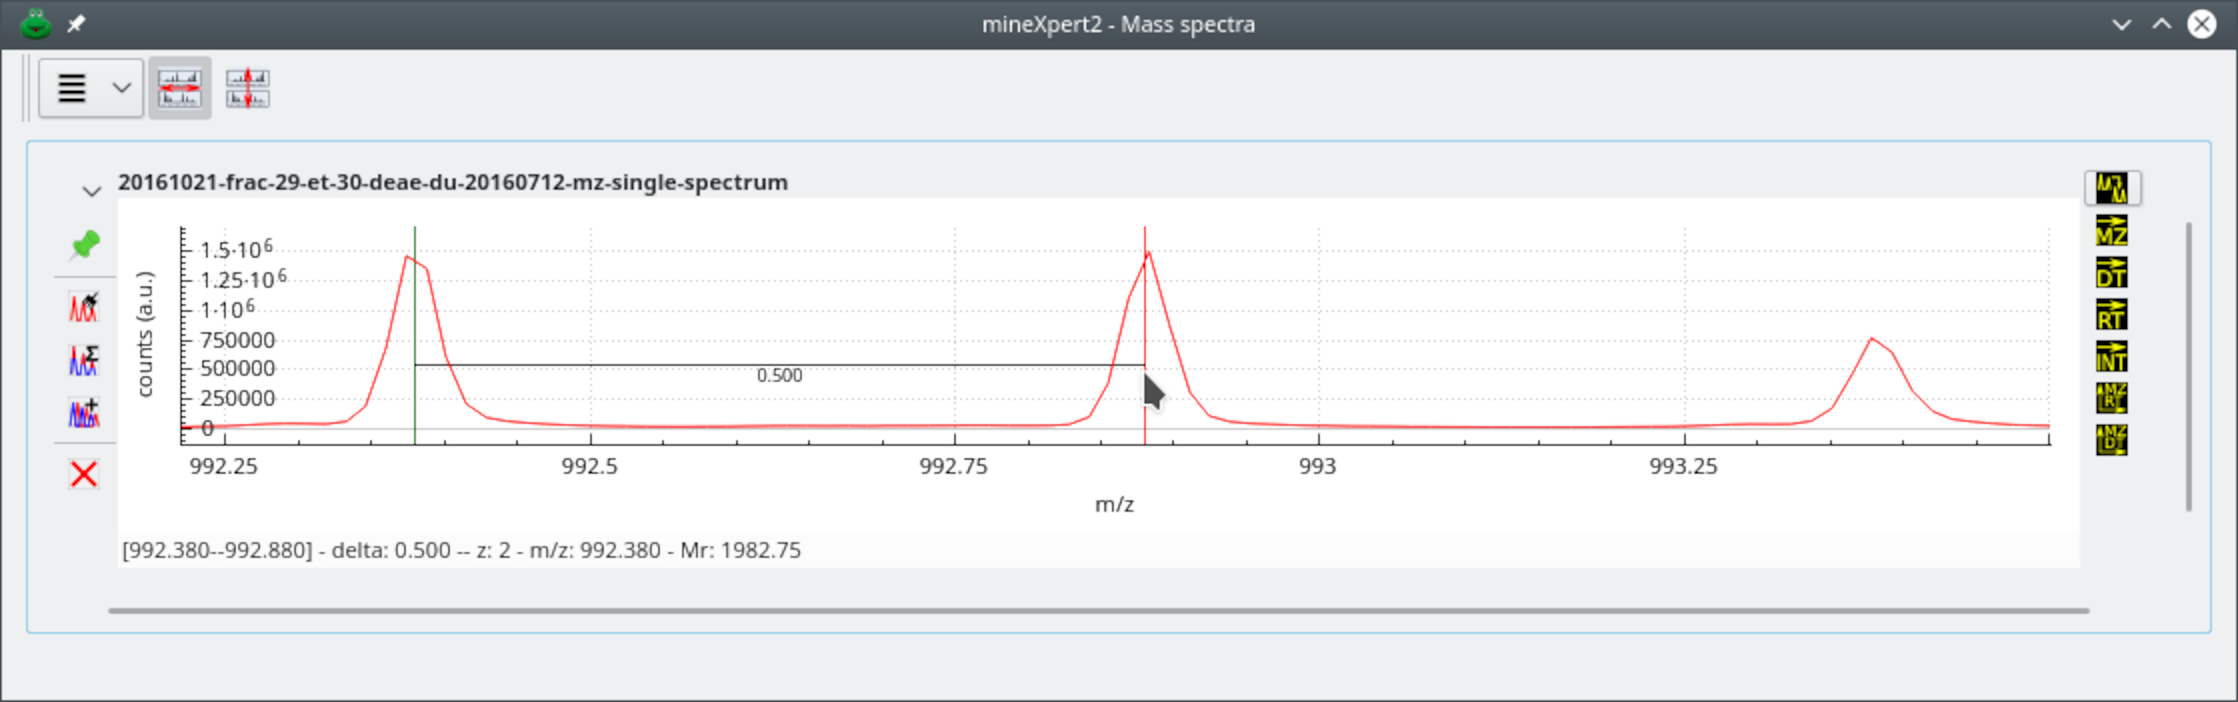
The user has performed a click-drag movement between the peak under the green marker and the peak under the red marker. The m/z distance between the two markers is computed and the inverse is the charge of the analyte under this isotopic cluster. If the first and second left peaks of the cluster are not suitable for easy centroid location positioning of the mouse cursor, use peaks to the right and remove the corresponding number of bumps to the right from the calculated monoisotopic mass value.
Figure 4.3: Isotopic cluster-based mass deconvolution #
Note: The mouse drag position is not significant
Note that the -click-dragging direction (left→right or
right→left) has no impact on the value of monoisotopic mass computed
because the software postulates that the lightest ion is the peak on the
left.
4.3 Reading the resolving power based on mass spectral data #
When -click-dragging the mouse cursor between two mass spectrum
locations of interest, the program computes the apparent resolving
power. This process is shown on Figure 4.4, “Calculation of the resolving power”, where the
resolving power is calculated by dragging the mouse cursor from one edge
of a peak to the other at half maximum height (this is called
full width at half maximum [FWHM] resolution).
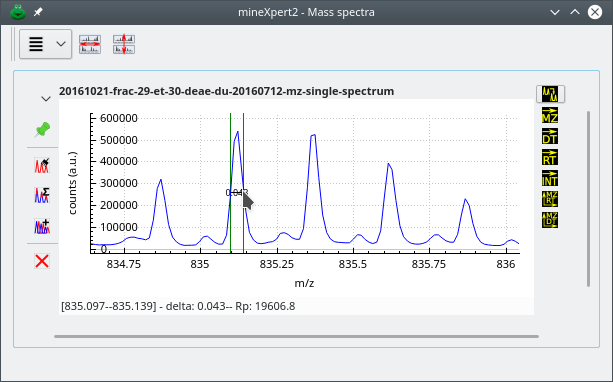
Click-dragging the mouse cursor will trigger the calculation of the resolving power of the instrument. That value is printed in the status bar.