mineXpert2 User Manual
6 The processing flow in a data exploration session
The mass spectral data sets that are open in a giving data exploration session are identifiable by the color of the traces. All the trace plots or color map plots obtained for a given mass spectral data set are distinguished from the other by the color used for the plotting (trace plots) or for the axes and labels (color map plots). The color is thus a means to maintain a visual “filiation” between plots. But for the various steps of mass spectral data exploration session involving the same mass spectra data set, there needs to be a way to record all these steps. That means is the subject of this chapter and is called Processing flow.
6.1 The processing flow records all the steps in a data exploration session #
As said above, the “filiation” of the plots is maintained using identifying colors. However, color is not enough to unambiguously identify the “filiation” of any given plot. Indeed, the same TIC chromatogram or color map plot can be used multiple times as the starting point to perform multiple integrations. For example, from a given TIC chromatogram, one would be interested in a number of different chromatogram peaks, between various time retention ranges. By performing integrations for each peak of interest, the user will generate a number of plots that actually originate from the very same TIC chromatogram of the very same mass data set. The newly created plots will have the same color as the one of the originating plot, but it will not be possible to distinguish between all the “child” plots. This is why whenever a new plot is created, a processing flow is attached to it that corresponds to the same processing flow of the originating plot plus a new step with the last integration details. This way, each plot will carry with itself the whole integration “history” that led to its creation. This processing flow is shown upon selection of the menu item from the main menu belonging to the composite plot widget that contains the plot for which the “history” is enquired about.
A processing flow is a collection of as many steps are necessary to describe thoroughly all the processing steps that were required to produce a given trace or color map plot. A processing step is described using as many processing specifications as necessary to thoroughly describe that step.
A typical processing flow of a currently selected trace (or the only trace plotted in the composite plot widget) is shown like depicted in Figure 6.1, “The processing flow dialog window”.
Each trace or color map plot has a Processing flow record that shows all the steps that led to it through the exploration session.
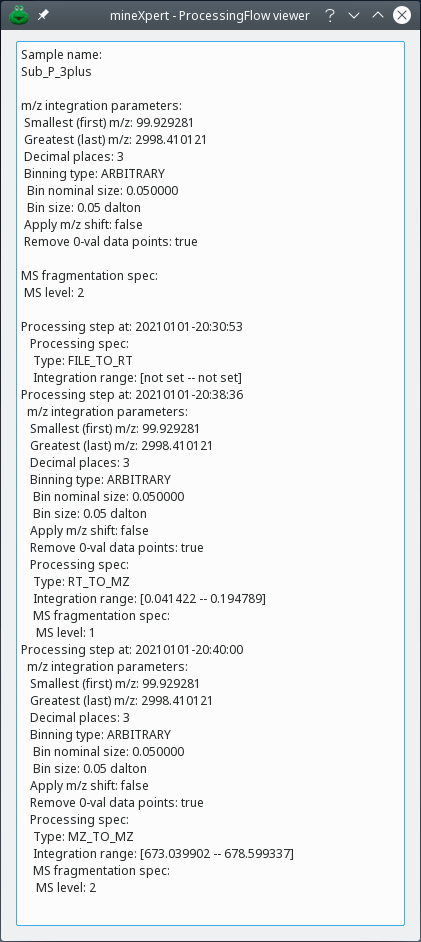
Figure 6.1: The processing flow dialog window #
This figure shows the processing flow for a MS/MS spectrum (MS level 2). The text details all the steps, from the loading of the mass data file to the obtention of the MS/MS spectrum. In this example, the processing flow lists the following informative elements:
The Sample name: name of the sample inside of the mass spectral data file (a file might contain more than one run, each run having a sample name).
The m/z integration parameters: the values listed in this section are relative to the whole mass spectral data set, like Smallest (first) m/z or Greatest (last) m/z, for example. The other values, like Decimal places, or the Binning type are the last values used during the course of the integrations. These values describe the configuration of the most recent integration step. In the present case, the last integration was a MS level 2 integration and the MS level is thus described to be of value 2.
Processing step: processing step containing processing specifications (Processing spec). The processing steps are recorded with a time tag so that it is possible to sort them out in increasing time order. In the example, the first processing specification is of type FILE_TO_RT thus describing the data file loading of the mass spectral data set. There is of course no integration range for that specification as the loading of a mass spectral data set is not formally an integration.
Another processing step was performed later in the data exploration session and was recorded in another processing step. The specification is of type RT_TO_MZ, describing the integration from the TIC chromatogram to a mass spectrum[13].That integration only accounted for mass spectra acquired between the values listed for the Integration range. The integration only took into account MS 1 level spectra.
A third processing step describes the second integration, and this step started at a mass spectrum (the mass spectrum generated at the previous integration), as described with the information bit Type: MZ_TO_MZ. Indeed, the integration began in a mass spectrum and yielded a mass spectrum. The MS level is set to 2 because that integration dealt with MS/MS spectra recorded for the precursor ions contained in the m/z range mentioned for information bit Integration range.
[13] RT stands for “retention time”, that is, TIC or XIC chromatogram; MZ stands for mass spectrum; DT stands for drift spectrum.